
Build
Data and dashboards
The right figure, in one place for everyone, updated on its own.
The problem with reporting is almost never the tool: it is that two people calculate the same indicator differently, and the meeting is spent working out who is right. We start by writing down the definition of each figure — what it counts, what it excludes, over what period — and we put it in the dashboard, next to the figure. Automation comes after that, and only matters if the figure is right.
The method
How we work
- 01
We write down the definition of each indicator
In black and white, validated by the people who use it. Everyone skips this step, and it is the only one that ends the arguments about numbers.
- 02
We connect the real source
Straight onto your production data, with no intermediate copy. Every manual copy is a place where the figure can drift without anyone noticing.
- 03
We build the screen people actually open
Few indicators, readable in ten seconds, on the device you will really look at — often a phone, sometimes a weekly email.
- 04
We automate the delivery
A report you have to remember to fetch does not get read. Scheduled sending, plus an alert when an indicator leaves its usual range.
What you get
Deliverables
- check_circleThe indicator dictionary: definition, source, what is excluded
- check_circleThe online dashboard, fed by your production data
- check_circleScheduled reports, by email or as exports
- check_circleOut-of-range alerts on the indicators that matter
The proof
Where we have done it
FlatBay
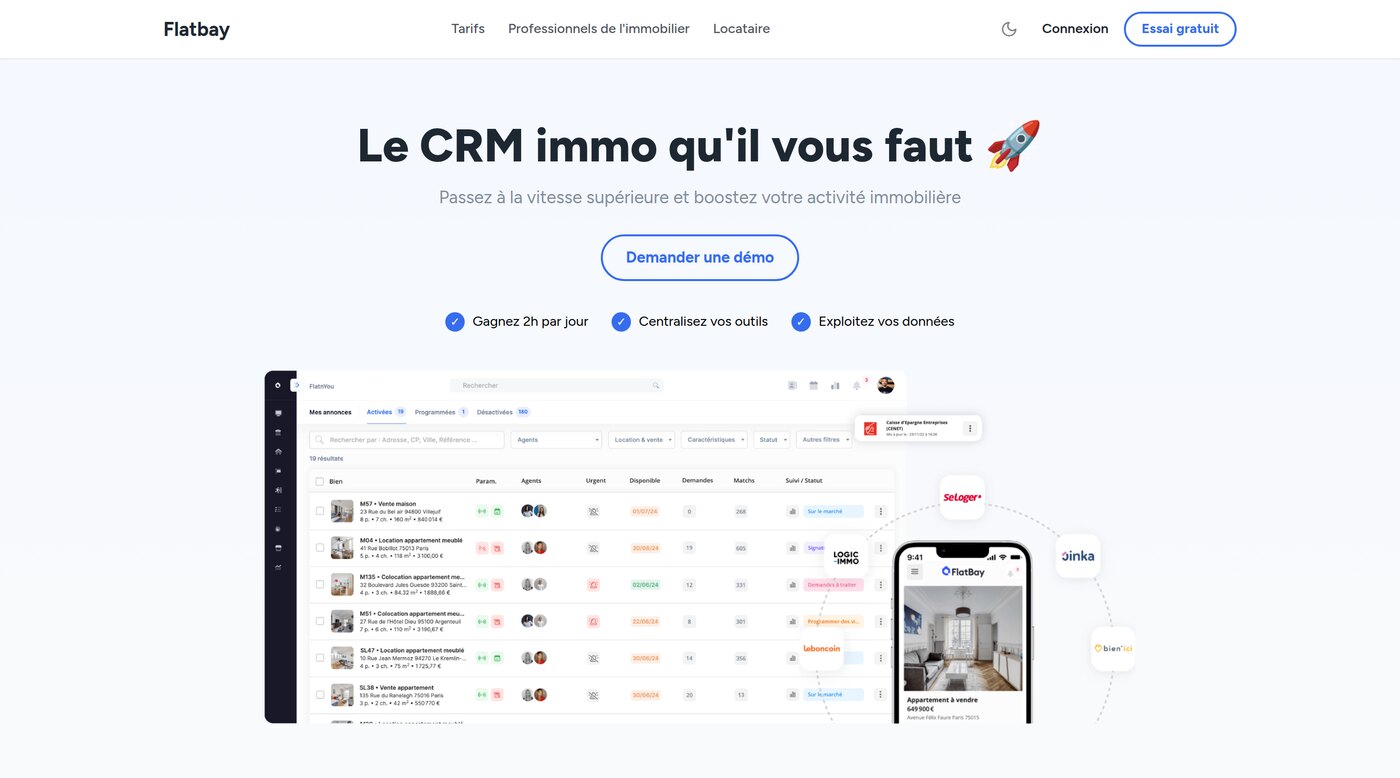
Since 2015Agencies drowning in incomplete files. An assistant that chases missing documents, computes the affordability ratio, and only passes on complete applications.
Read the case studyarrow_forward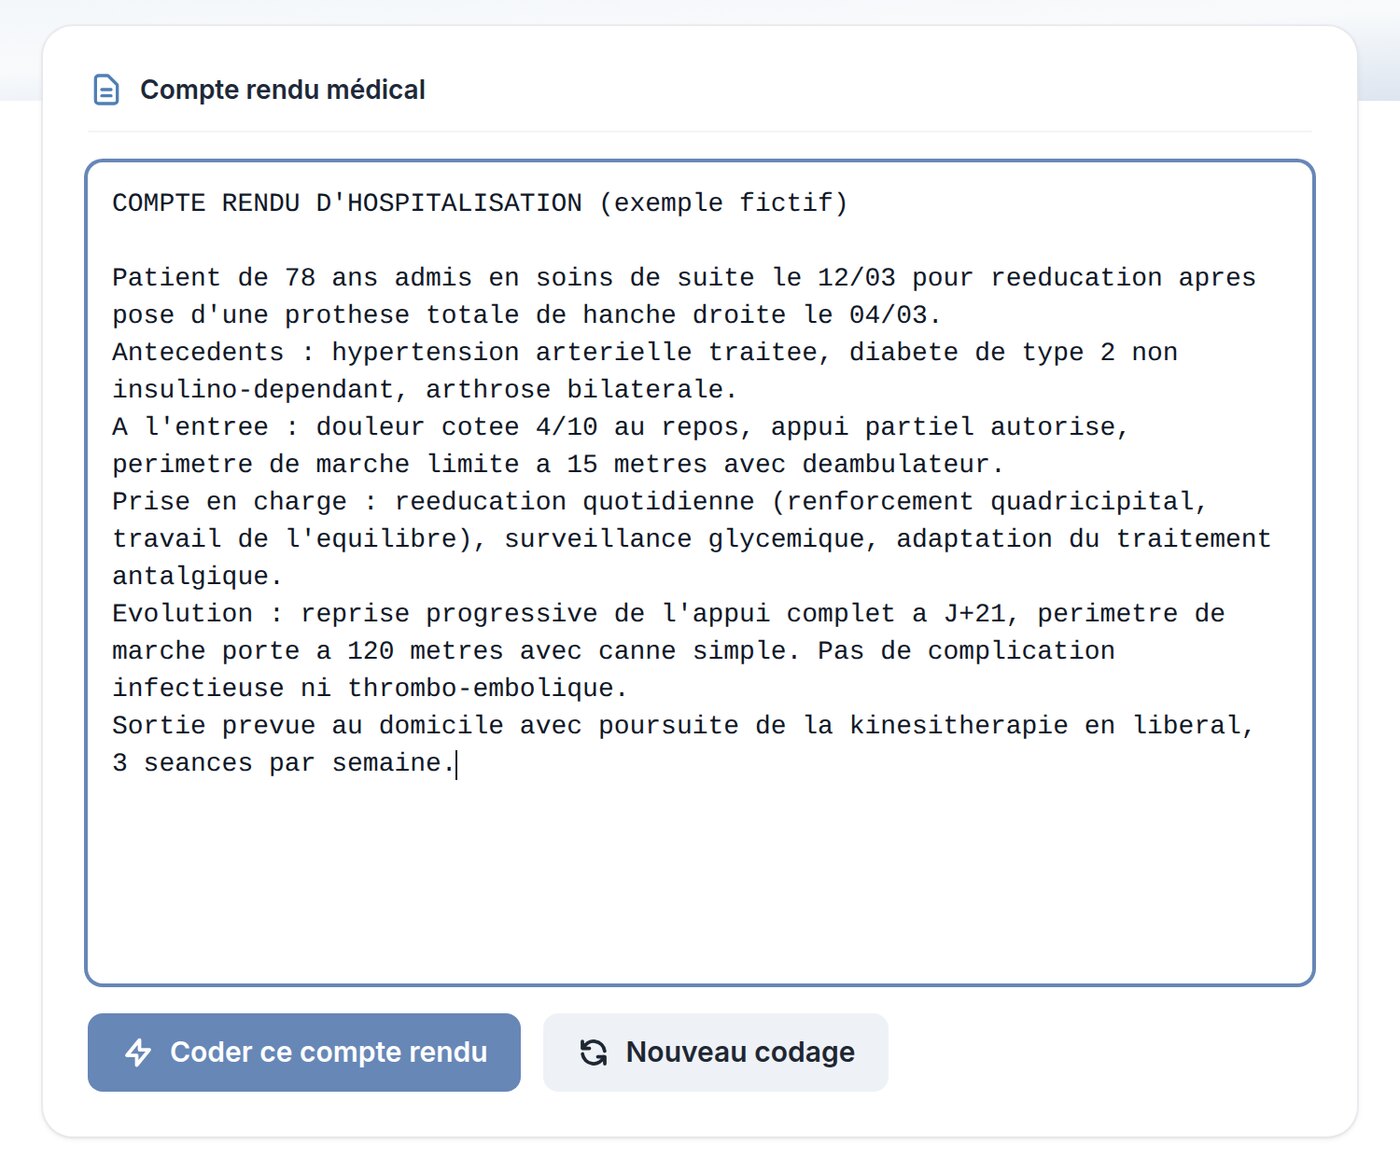
Gextra AI
Since 2026How a stay is coded determines what the facility is paid. An AI-assisted review flags under-rated severity levels, and the doctor decides.
Read the case studyarrow_forward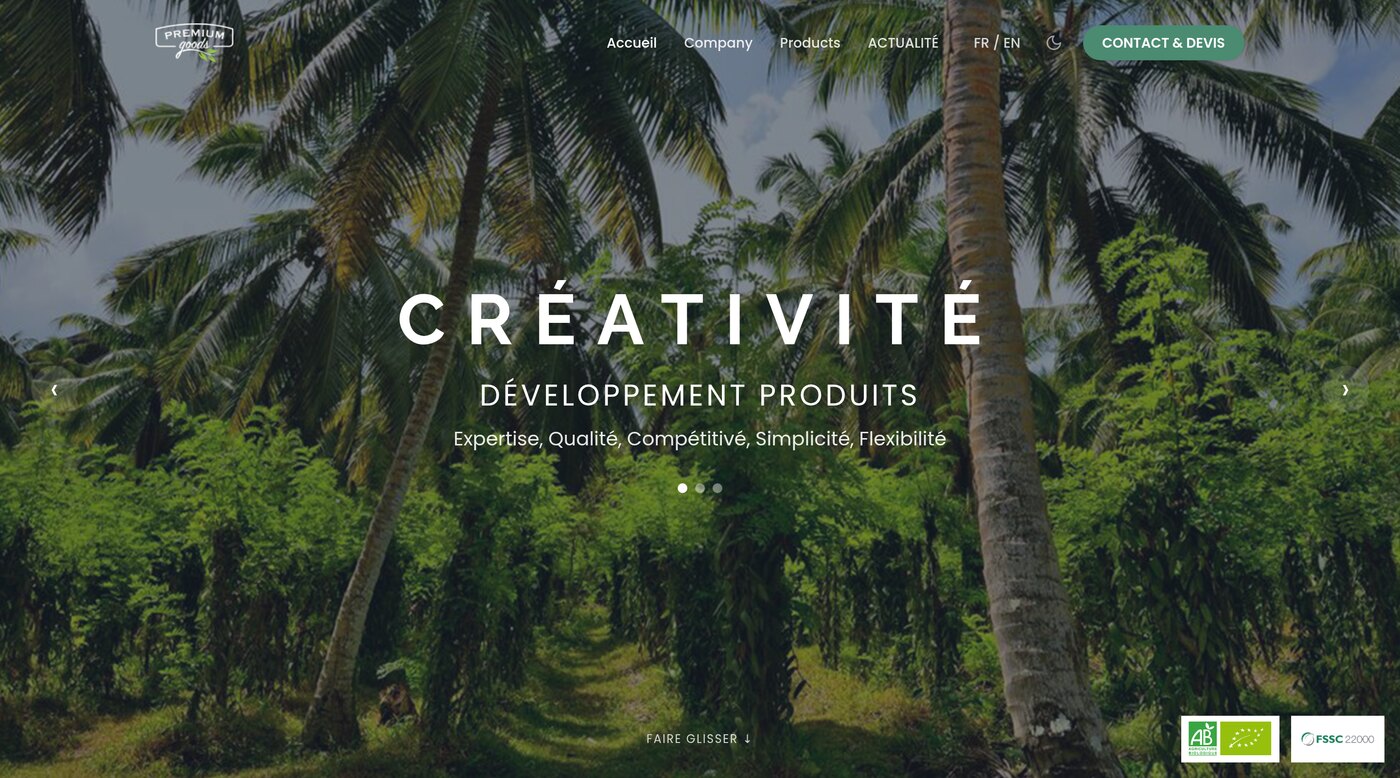
Premium Goods
Since 2019An online shop and the internal tool that runs it: stock, orders, suppliers, field work. Modernised progressively, without ever closing.
Read the case studyarrow_forward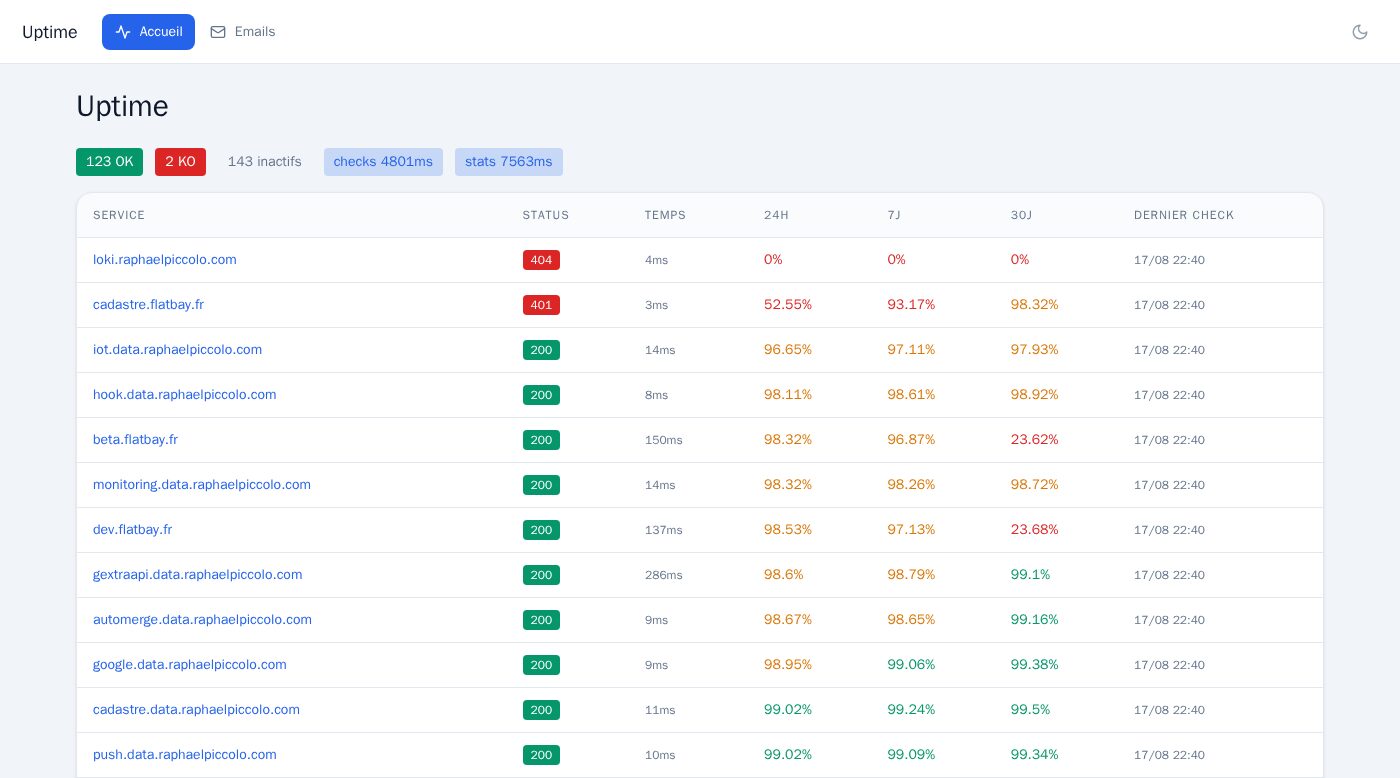
Notre flotte
Since 2010Git, continuous integration, image registry, SSO, DNS, metrics, logs, monitoring: all of it runs on our own machines, on open-source components. Not out of principle — because it holds load better, costs a fraction, and does not stop when a vendor changes its mind.
Read the case studyarrow_forwardFrequently asked questions
- Do you use Power BI or Looker?
- If you already have them, we connect to them. Otherwise we build the screen inside your own application: people are already logged in there, and one fewer licence is one fewer renewal.
- Will the dashboard slow the application down?
- It can, if written badly: an indicator computed over millions of rows on every view has a price. We pre-compute what can be pre-computed and measure the cost of each query before putting it live.
- Can we go back through history?
- Only if the data was kept. It is the first question we ask, because the answer is often no — and you then need to start measuring immediately in order to compare in six months.
Also in “Build”
Custom software development
The application your business runs on, when nothing off the shelf fits.
webWebsite design and rebuild
A fast site that says what you do, and makes people want to call.
smart_toyAI and process automation
We identify what AI can genuinely absorb in your business, and take it all the way to production.
move_upLegacy migration and code takeover
An application nobody dares touch any more, brought back into shape without stopping the business.
smartphoneMobile applications
One codebase for iOS and Android, published on both stores.
hubIntegrations and business APIs
Getting your tools to talk to each other, so nobody re-keys the same data twice.
Let's talk about your project
Thirty minutes is enough to tell whether we are the right fit. We reply within 48 hours, and we say no when it is not for us.